Another fantastic week for TS! 545 new pips
NB: This analysis is being posted before the outcome of the Fiscal Cliff Summit meeting. This event has the potential to significantly shift markets and undermine my, or any, technical analysis.
Last week: The markets were a bit choppy whilst waiting for some direction regrading the Fiscal Cliff. The previous week’s EUR/AUD carried through and delivered a further 100 pips to make a total of 400 pips from that trade. New TS signals gave an extra 445 pips; E/J gave up to 280 pips, the A/J gave 120, and the G/U gave up to 45. These signals have now closed but some of these pairs look like they could be setting up to form further moves and breakouts from new levels.
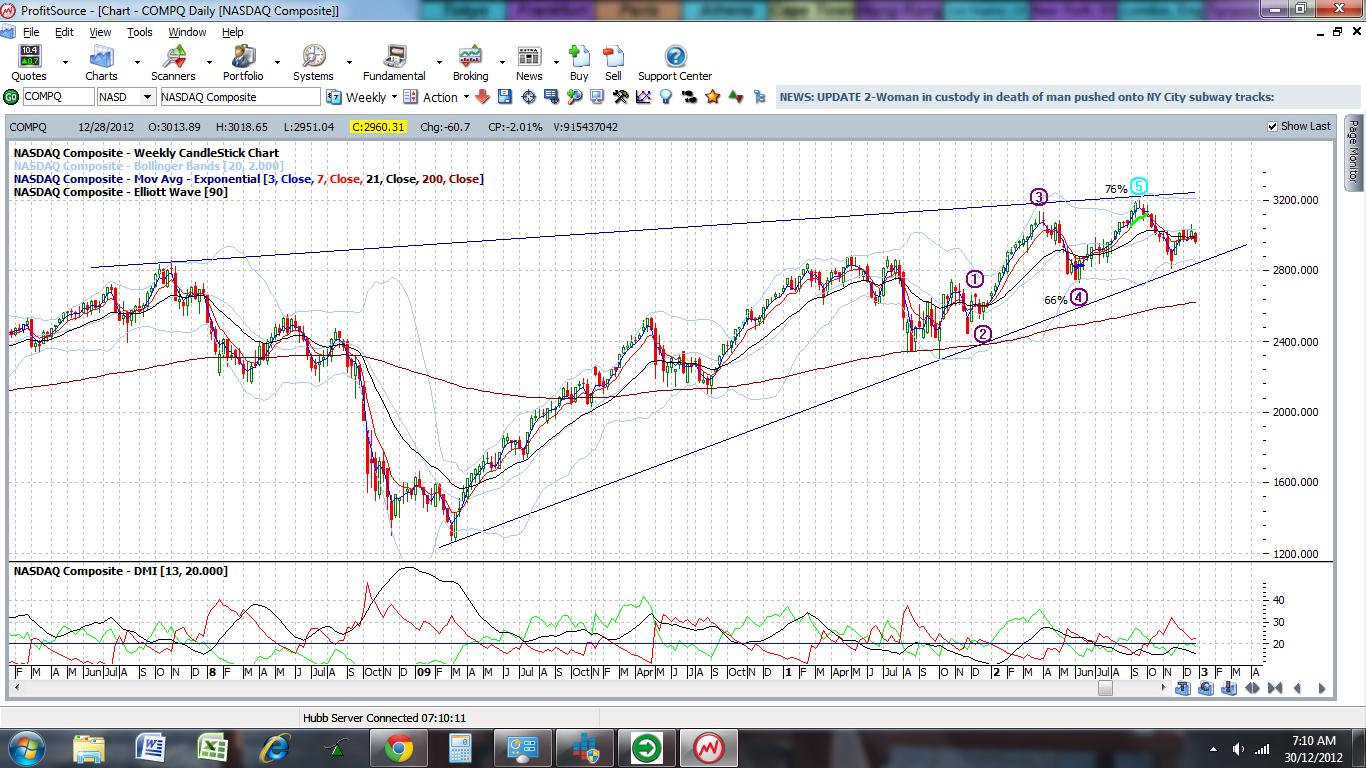
Stocks took a hit last week with all the 'Fiscal Cliff' anxiety but the S&P500, NASDAQ and Dow are still holding above weekly trend lines. I won't get too concerned until these levels are breached:
- S&P500 has also held above the psychological 1,400 level

- NASDAQ is still below the 3,000 level
- The Dow is below the 13,000 level

The Ichimoku Clouds are struggling to hold the S&P500 and Dow indices up though:


The VIX is now trading up on all the fear but it, too, is trading under a weekly trend line. Like with the stock indices, I won't get too worried unless this level is broken:

This week: The Fiscal Cliff will continue to dominate investor sentiment this 'New Year' week following the US Sunday summit meeting. It remains to be seen how the markets will react to whatever deal, if any, is reached at the Sunday summit. This continues to make technical trading quite challenging. I will continue to trade cautiously until the full impact of any Fiscal news is reflected in any new chart trends.
My preferred pairs for this week, as they stand at the moment, are the: E/J, E/U and EUR/AUD due to Ichimoku alignment on the EURX charts. Secondly, the A/U, A/J and, then, the Swissie and Kiwi.
My preferred pairs for this week, as they stand at the moment, are the: E/J, E/U and EUR/AUD due to Ichimoku alignment on the EURX charts. Secondly, the A/U, A/J and, then, the Swissie and Kiwi.
E/U: The monthly bullish inverse H&S pattern is still valid. Price has also formed a bullish inverse H&S pattern on the weekly chart! Price is trading in a large flag pattern and just under the weekly 200 EMA. This weekly 200 EMA offers a good opportunity to enable a trade entry in ‘risk on’ continues. Price is still trading above the Cloud on the daily Ichimoku charts but in the top edge of the Cloud on the 4hr chart. The weekly candle closed as a bullish candle but with a long upper shadow reflecting some indecision. Have a close look at the weekly chart of the E/U though. I have been noting for some time that I see an 'inverse H&S' pattern printing here and this is stamped on my chart. Well, to me, the weekly 200 EMA (brown line) looks like it's a pretty good fit as the 'neck line' of this pattern. Thus, a break, close and hold above this weekly 200 EMA would be most significant indeed!
- I will look to SHORT the E/U on a new TS signal, if ‘risk off’ returns and if price breaks down from the flag pattern.
- I will look to LONG the E/U on a new TS signal, if ‘risk on’ returns, if price breaks up and out from the flag pattern and closes and holds above the weekly 200 EMA.


E/J: Price has continued to hold out and up from the broken bear trend line of the monthly chart that dated back to mid 2008! Yen easing continues to help this pair. Price is still trading above the Cloud on the daily and on the 4hr chart which is bullish. The weekly candle closed as a bullish candle. BoJ easing continues with Yen pairs though. The 111 level proved to be a hugely significant level for this pair as it has been a major S/R level going back for some years. I had said last week that the longer this pair stays at, or above, this 111 level then the more likely it will be to move on and up from here. This continuation came last week with a new TS signal that gave 280 pips. Price is currently sitting and waiting just under the weekly 200 EMA which, like the E/U, will offer another opportunity to enter a LONG trade on the E/J if ‘risk on’ continues.
- I WOULD look to LONG the E/J on any new TS signal, if ‘risk on’ returns and if price closes and holds above the weekly 200 EMA. (I am still LONG the E/J from last week)
- I STILL WON’T SHORT the E/J this week given the ongoing stimulus.


A/U: Price was fairly choppy last week as sentiment weakened with ongoing Fiscal Cliff concern. The daily 200 EMA helped to hold price up a bit though. Price is currently trading within a channel and just above this level. Price is trading in the Cloud on the daily but below the Cloud on the 4 hr chart so price action may continue to be choppy. The weekly candle closed as a small bearish candle.
- I will look to SHORT the A/U on any new TS signal, if ‘risk off’ returns and if price closes and holds below the daily 200 EMA.
- I will look to LONG the A/U on any new TS signal and if ‘risk on’ returns.


A/J: Yen strength has continued to help this pair and a new TS signal gave 120 pips this week. Price is still trading above the Cloud on the daily and on the 4hr chart which is bullish. Price is trading in a flag pattern and at the strong S/R level of 89.
- I WON’T SHORT the A/J this week given BoJ stimulus.
- I will look to LONG the A/J on any new TS signal and if price closes and holds above the flag pattern.


G/U: Price action was very choppy on this pair last week. Price is now trading above the Cloud on the daily but below on the 4hr chart so might continue to be choppy. This pair has been fairly messy lately and I'm not keen on trading it at the moment. Last week’s bearish ‘shooting star’ candle hinted at this reversal and this week’s candle closed as an indecision style Doji.
- I WON’T look to LONG the G/U on any new TS signal.
- I WON’T look to the SHORT the G/U on any new TS signal.


USD/SGD: Price has continued to be fairly choppy on this pair again this week. I am not looking to trade this pair this week but will just keep an eye on it for any new trend. The weekly candle closed as a bullish engulfing candle.


Swissie USD/CHF: This pair was fairly flat last week given the uncertainty surrounding the ‘Fiscal Cliff’. Price is still trading below the Cloud on daily and at the bottom edge of the Cloud on the 4hr chart which is bearish. The weekly candle closed as a small bearish candle.
- I MIGHT look to LONG the USD/CHF on any new TS signal and if ‘risk off’ returns.
- I will look to SHORT the USD/CHF on any new TS signal.


Loonie: USD/CAD: Price on this pair has chopped upwards this week. Price is trading in the top edge of the Cloud on the daily chart but above the Cloud on the 4hr chart so is starting to look a bit bullish. The weekly candle closed as a small bullish candle.
- I WON’T trade the USD/CAD.


Kiwi: NZD/USD: This pair has especially suffered from concern over the ‘Fiscal Cliff’. It is trading in the top edge of the Cloud on the daily but below the Cloud on the 4hr chart so might be choppy. Last week’s large bearish engulfing candle pointed to this action. Price is trading in a flag pattern near the monthly pivot.
- I MIGHT look to LONG the Kiwi on any new TS signal, if ‘risk on’ returns and if price closes and holds above the flag pattern.
- I MIGHT look to the SHORT the Kiwi on any new TS signal, if ‘risk off’ returns and if price closes and holds below the flag pattern.


EUR/AUD: The TS signal from the 2 weeks ago continued and gave up to 400 pips! Price has broken and held above a major channel trend line on the monthly chart. Price has now also formed a flag pattern under the major S/R level of 1.28 as it waits for the outcome of the ‘Fiscal Cliff’ Summit. The weekly candle was a small but bullish candle.
- I will look to LONG the EUR/AUD on any new TS signal and if price closes and holds above the 1.28 level.
- I will look to SHORT the EUR/AUD on any new TS signal and if price closes and holds below the flag pattern.


Gold/Silver: The bullish ‘Cup and Handle’ patterns on the weekly charts are still valid for the time being. The ‘handle’ part for both metal charts seems to be forming a bullish broadening ascending wedge pattern though now. The theory is that the breakout target is equivalent to the depth of the cup. The handle patterns can be seen on the daily charts and this is the area where you can see the bullish breakout. Both metals formed weekly candles that were indecision style ‘spinning top’ candles but both also held above major trend line support.
Silver weekly:
 Silver daily:
 Gold weekly:
 Gold daily:

Silver weekly:


No comments:
Post a Comment