Indices: Whoa.....check this out!
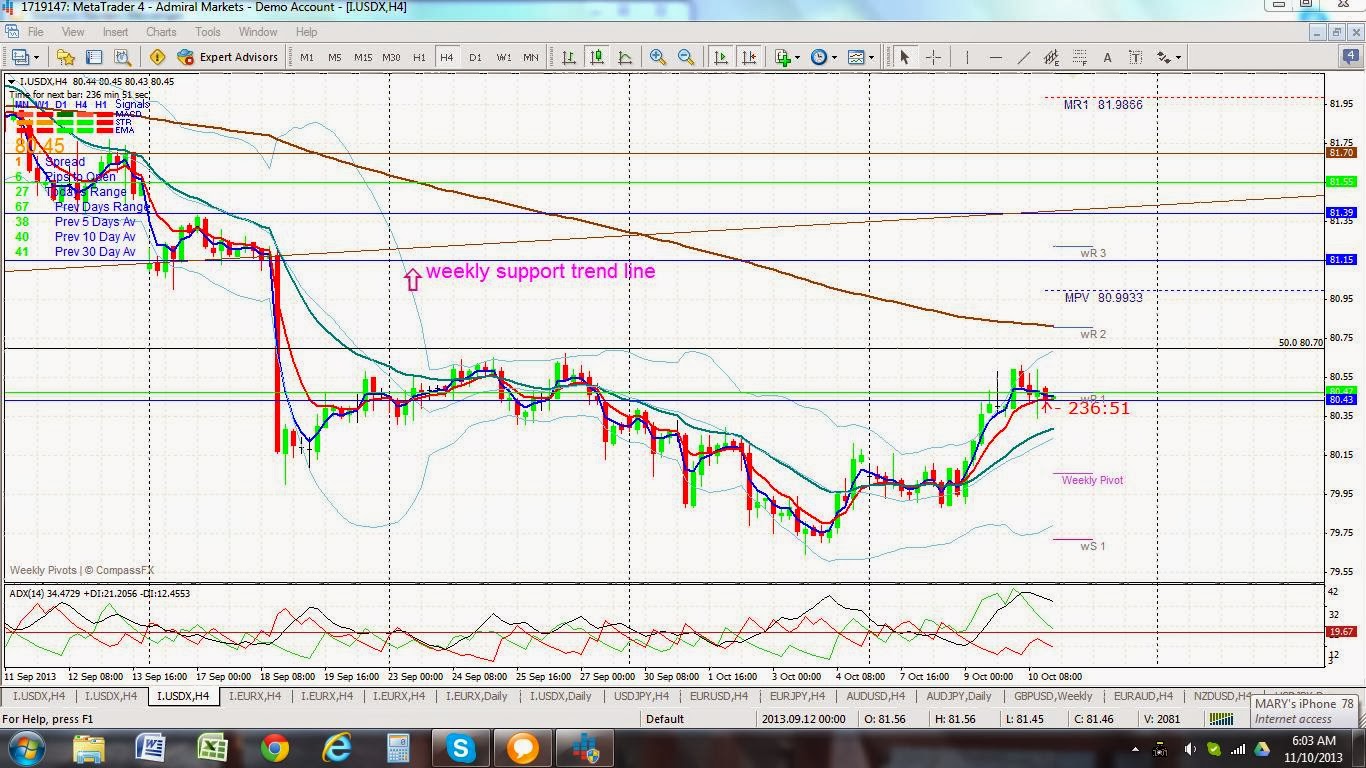
USDX:


E/U: I have a new TS signal here off my 8 pm candle:

Kiwi and Cable trying to form signals too but might take a bit longer.
Fri 11th ( 6 pm)
Indices: the USDX is planking again along the weekly 200 EMA. The EURX is still looking bullish under the monthly 200 EMA:
USDX:


E/U: holding above the 1.35 level and making its way back to the 4hr Cloud:


E/J: this signal has given up to 100 pips:

A/U: on the way to 0.95 and above?

A/J: the bullish break from the descending broadening wedge has given over 150 pips!

Cable: has held above the daily trend line and is trying to form up a new TS signal on the 4hr chart:


Kiwi: has made a triangle break but no TS signal just yet:


AUD/NZD: has failed to get above the 1.145 and the TS signal failed:

Well, we've had a glimpse at what any resolution to the US Government shutdown will do to the markets. A small glimmer of hope has sent stocks rallying hard. A weekly close back above the key 1,685 will be significant:
S&P500:
EURX: this has rallied back now to be just under the major resistance area of the monthly 200 EMA. I had noted earlier in the week that I think this boundary will be the marker for 'risk' and I still believe that to be so: a break higher for clear 'risk on' and a failure to break as clear 'risk off':

USDX: this rally has stalled and I'll be keen to see where it closes as it is back below the weekly 200 EMA at the moment.
E/U: has closed for -20:

E/J this signal is up 50


A/J: no clean TS signal but the bullish descending wedge break evolved:


Kiwi: still triangle trading:

U/J: the trend line break evolved and price is back above the 4hr Cloud:


Swissie: back loitering near a major S/R level of 0.91:

A/N: signal down BUT I'd be waiting for any break above the 1.145 anyway:

Thurs 10th Oct (9 pm)
EURX: bouncing upwards

USDX: testing the broken weekly 200 EMA:


U/J: testing the trend line still:

AUD/NZD: a new long TS signal

Cable: no reaction just yet to rate news:


Thurs 10th Oct (3.40 pm)
U/J: this is edging back up towards a daily bear trend line. Price had broken down and out from a triangle pattern but found support at the 97 level. The bullish momentum is now taking the U/J back up to test this bear trend line. A level worth watching!

A point worth noting is that a bullish trend line break here would dovetail with a break above the 4hr Ichimoku Cloud!

Stocks: I have updated my Stocks:Oct page.
USDX: this has now made a bullish 4hr candle close above the weekly 200 EMA and triggered some 'risk off' movement:


A/U: down on mixed employment data:

Cable: still down below support trend line. Remember there is red flag news here later though!:


Stocks: I have updated my Stocks:Oct page.
Indices: the USDX is having a bullish run through the Asian session. The EURX is holding on though:


Cable: this pair closed right on top of the daily support trend line; depending of the vagaries of where one draws said trend line that is! More importantly though, there is 'red flag' news on this pair later today...interest rate news. I'd be waiting on this pair until after that for sure!
Cable daily: price closed below the monthly pivot but on top of the support trend line:

Cable 4hr: there has been a signal on the 4 hr chart on my midnight candle. One would have to be careful taking any longer term USD based trade though. Any US Govt resolution could trigger large moves as could GBP rate news later.

Thurs 10th Oct (6 am)
Indices: the USDX had a shot at trying to get over the weekly 200 EMA level but has failed to make a close above this key S/R level just yet. This bullish play has moved the index back above the 4hr Ichimoku Cloud though and has upset the Ichimoku 'risk on' alignment:


EURX: I'm still surprised to see this index holding up so well and it is still trading with a 'risk on' alignment. The monthly 200 EMA is still just above current price and is a major hurdle in its path. I believe that this S/R level will determine the next momentum move: a break and close above for 'risk on' and a respect and rejection for 'risk off':


S&P500: the broken daily trend line is being tested which is not uncommon. FWIW: I do not have a clear TS 'sell' signal on the daily chart. The lack of committed long term momentum isn't surprising though given the current US Govt situation. Many believe that a resolution of this debate will be 'stock positive' so it makes sense that long term short plays might be limited. I still believe that trading off shorter term charts during the US session is still the safest option

E/U: I did get a new TS signal and price has moved below the 4hr Ichimoku Cloud BUT I would prefer to see a close and hold below the 1.35 S/R level first. This is also a tricky play given the US situation. Any resolution might be positive for stocks but it might not be for other risk instruments IF the resolution also boosts the USD. A rally with the USD would put pressure on this pair and, also, the Cable, Aussie Kiwi eyc.


Cable: this pair has made a break below the support trend line on the 4hr chart and, also, below the 4hr Ichimoku Cloud. This 4 hr move has produced a new TS signal BUT I would be waiting to see if price closes below the support trend line on the daily candle close first. A close above this level on the daily might signal strong support:


A/U: choppy but still above the 0.94 and still above the Ichimoku on the 4hr and daily:


Kiwi: holding on to the 0.83 for its life!

U/J: chopping around the 97:

AUD/NZD: very choppy but grinding upwards. I think the safest long play would be to wait for any break, close and hold above the daily S/R level of 1.145:


I'm wondering how any US Government budget resolution will play out for the USD and for risk instruments? Will it trigger a USD and stock rally but leave the E/U, Aussie and Kiwi struggling OR will there be a more conventional style of 'risk on' rally? Will a US default trigger a return to a conventional 'risk off' rally?
Wed 9th Oct (9 pm)
Indices: The USDX is ticking up towards the weekly 200 EMA. Surprisingly, the EURX although choppy is holding up pretty well though too:
USDX:


E/U: down bu no TS signal:

A/U: choppy but holding up above the 0.94 still for the time being:

Cable daily: down but still above daily support:


US Government shutdown woes continue. The safest trading seems to be off the shorter time frame charts during the bigger volume London and US sessions.
Indices: USDX is still flat:


FTSE: would have been a safe intra day trade!

S&P500 30 min: ditto here too

S&P500: daily trend line looks set to be broken today. If so, that is a bearish development:

S&P500 Ichimoku: Cloud being tested too

Silver: holding out and up from the wedge breakout:

Gold: hovering near trend line:

FX was less active though...except for the Aussie pairs perhaps:
E/U: still in a triangle


G/U: still above daily support

Kiwi: clinging to the 0.83


Swissie: clinging to weekly support:


I have to travel interstate today. I won't update again until later this afternoon.
No new TS signals on the 8 pm update. No surprises there!
EURX: biding its time...maybe its 'waiting for Sue'!

Tuesday 8th Oct (6.30 pm)
AUD/NZD: this pair is edging higher after bouncing off the triple bottom and might be heading to test the key S/R level of 1.145 again. A close and hold above this level would void the potential bearish daily chart H&S:
A/N daily chart:

A/N 4 hr: no new TS signal just yet though:

A/J: might be heading for a bullish breakout here. It is the 'risk' bellwether FX pair!

U/J: this signal has now closed for a loss of 20 pips.

Tuesday 8th Oct (3.30 pm)
GBP/CHF: A trader was asking for my technical thoughts on the GBP/CHF. I'm not sure how serious they were though given the pegging of the CHF and lack of movement thereafter across many CHF related pairs. I'm also not sure how valid any technical analysis is in such situations but, here goes anyway:
Monthly chart: Price declined from 2007 to 2011 but has been fairly flat since then. Price is butting up against the monthly Ichimoku Cloud now though and, with this fairly new October candle, is currently trading just in the bottom edge of the monthly Cloud. It is worth noting that the last monthly candle to trade anywhere in the Cloud was back in Dec 2007! So, this in itself, is some bullish achievement.


Weekly chart: Price is forming up into a rather acute triangle pattern. I would attribute this to 'pegging' issues though. Price is trading in the Ichimoku Cloud but the Cloud is fairly horizontal and, also, fairly thin. ADX is below 20 so, there are no overall momentum clues here yet.


Daily chart: trading up nearer to the weekly chart bear trend line. It is only about 250 pips away from this upper trend line. It might be trying to make for a break for it BUT....can it do so given its 'pegging' issues? There is no momentum indication here from the ADX so no real clues here yet. Price is trading above the Cloud BUT there was a bearish Tenkan/Kijun cross recently.


4 hr: ADX shows that momentum from the last 'down' move is waning. I'd watch this ADX for clues as to the next directional move. Price is trading below the Cloud on the 4hr chart which is short term bearish.


Overall: The GBP/CHF has basically chopped sideways for two years, albeit in a triangle pattern of sorts. Price is attempting to take on the monthly Ichimoku Cloud though which gives it a bit of a bullish tint. It is also trading up near the weekly chart bear trend line. I'd be watching the weekly chart bear trend line and the ADX for clues about any longer term directional moves. A bullish break could be looming or it may just keep tracking within the triangle. As always, trend line breaks might offer the best guidance here.
U/J: This is currently testing the broken 97 level:

It's worth noting that the Nikkei is back trading positive at the moment and, as I noted earlier today, the S&P500 is at support too. So, any return of 'risk appetite' with stocks might not help any U/J short.
Gold and Silver:
I've had both of these metals trading in bullish 'descending broadening wedge' patterns for the last few weeks. This wedge for Silver also looked like it could be part of another bullish pattern;that being a bullish 'Cup'n'Handle' pattern. Silver has now broken up and out from its wedge but Gold has yet to follow:
Silver 4hr


Cable: there was a TS signal and 4hr chart trend line break on this pair last week that gave a 100 pip move. This signal has now closed and price seems to have found support at the 1.6 level. It is important to remember that price is only about 200 pips or so below the major bear trend line of the monthly chart triangle pattern:

So, given this price pause, I have stepped out to the daily chart to look for new S/R levels and have drawn in a new daily support trend line:

Thus, although price has broken 4hr support it is still above daily support and that may prove to be significant.
I do suspect that any US Government Budget resolution might spin the markets into 'risk on'.
S&P500 and U/J: The S&P500 has slipped below key support levels BUT it is still trading above the daily support trend line and, also, above the daily Ichimoku Cloud albeit only just! Note, also, how the Ichimoku Cloud is thinning and this suggests it will offer reduced support if indeed it comes under much pressure:
S&P500 daily:


U/J: I do have a short signal on this but I'd be wary given the state of the S&P500. Support for the S&P500 may flow over to support for the U/J as well. Failure of the S&P500 to hold above the daily trend line and Ichimoku Cloud might see U/J price continue to fall though:

Kiwi: forgot to post this earlier. No signal yet and no flag break:

IMHO: Trading FX, whilst waiting for any US Government shutdown resolution, will mean you will have to be nimble.
Indices: the USDX is flat but the EURX has dipped a bit:
USDX:


S&P500: down but still above the support trend line:

U/J: gave a new TS signal on my midnight candle and is still below the 97.

E/U: still edging higher within the new triangle. Remember, 1.365 is a major S/R level:

A/U: holding above the 0.94:

A/J: chopping down in the wedge pattern:

G/U: this signal closed after giving 100 pips:

U/J: closed below the 97 level but no TS signal just yet.
Kiwi: Ditto for the Kiwi.
E/U: this is how the chart looks to me now:

U/J: the 97 level is under pressure at the moment and I'll check after my next candle to see where it closes. A TS signal is trying to form up here:

Kiwi: a signal trying to form up here too:

Silver: holding above the $21.50 for now:

Gold: holding above the $1,300 for now:

It is a public holiday here today so things have been rather quiet. The indices haven't moved too far either:
USDX:


U/J: I am aware that the U/J has broken down through the triangle BUT the 97 is acting as strong support. A break and close below this 97 level might be the best way to gauge future bearish sentiment:

Daylight Savings has kicked in too so my chart update times are now:
4 pm, 8 pm, 12 midnight, 4 am, 8 am and 12 noon.
No comments:
Post a Comment